|
The viewing window is the part of
the coordinate plane that will be visible on your graphing
calculator screen.
|
|
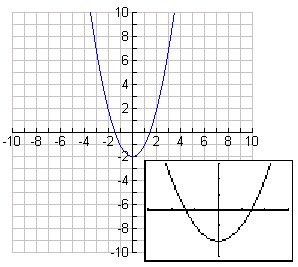
Remember that you are only
seeing a "portion" of an entire graph in your viewing
window. Think of your calculator view
screen as a small magnifying glass that lets you
see a PART of the entire graph.
Notice that the calculator
viewing window at the left shows only a small
3x3 grid section of the entire parabola.
The graph paper view shows a larger portion of
the parabola graph. Also notice that
the calculator view shows a somewhat "wider" looking parabola. The
window's aspect ratio (affecting the actual x
and y scales) is 3:2 (not 1:1). The normal
window is a rectangle, not a square. |
|
You need to understand how the
viewing window is set up and how to control its size.
|
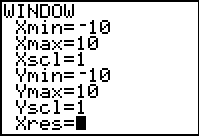 |
The WINDOW key allows you to control the viewing window.
The default window (also obtained with ZOOM #6 ZStandard) is
the 10 x 10 window shown at the left.
|
|
Xmin = minimum value displayed on the x-axis
Xmax = maximum value displayed on the x-axis
Xscl = distance between the tick marks on the
x-axis
Ymin = minimum value displayed on the y-axis
Ymax = maximum value displayed on the y-axis
Yscl = distance between the tick marks on the
y-axis
Xres = pixel resolution.
Xres = 1 means that functions are evaluated and
graphed at every pixel on the x-axis. |
|
Xmin must be less than
Xmax
Ymin must be less than Ymax |
|
Setting
set Xscl =0 and Yscl = 0
will turn the tick marks off. |
|
To change window settings on the WINDOW screen:
-- use your up or down arrows to move to the item to be
changed
-- enter the new value (which clears the original
value)
-- arrow down or hit ENTER.
Format Settings (2nd ZOOM)
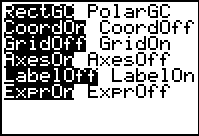 |
... sets cursor coordinates to rectangular or polar coordinates
... sets coordinates display on or off
... sets grid on or off (GridOn shows dotted background
screen)
... sets axes on or off
... sets axes label on or off (labels axes, but not ON the
axes)
... sets expression display on or off |
What is the physical layout of the
TI-83+/84+ view screen
in terms of pixels?
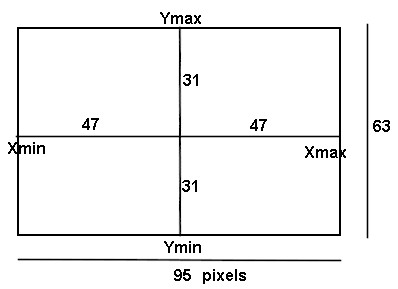 |
Pixels are the small cells that light up
when you graph. If you turn your screen very dark (hit
2nd up arrow repeatedly) you will see the actual pixels in
the screen display.
The default viewing window is set up in a 3:2
aspect ratio. The window is NOT a square.
Because of these set pixels, the "nicest"
viewing windows have Xmin and
Xmax values that differ by a
multiple of 47. |
|