Frequency Tables
Frequency Tables
From a Frequency Table:
| X | 0 | 1 | 2 | 3 | 4 | 5 | 6 | 7 | 8 | 9 | 10 |
| f | 3 | 4 | 7 | 4 | 10 | 9 | 7 | 3 | 6 | 2 | 4 |
prepare a histogram representing this data.
| 1. Enter the data values in L1. Enter their frequencies in L2, being careful that each data value and its frequency are entered on the same horizontal line. (See Basic Commands for entering data.) |
|
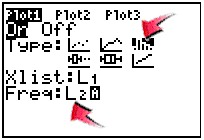
| 2. Activate the
histogram. Press 2nd STATPLOT
and choose #1 PLOT 1. You will see the screen at the right. Be sure the plot is ON, the histogram icon is highlighted, and that the list you will be using is indicated next to Xlist. When using a Frequency Table set Freq: L2 so that the number of times the data values appear will be determined by the numbers appearing in L2. |
|
| 3. To see the histogram, press ZOOM and #9 ZoomStat. Press the TRACE key to see on-screen data about the histogram. The screen to the right shows the histogram developed directly from the ZoomStat choice of increments. Not so nice increments! |
|
| 4. Adjusting the Xscl value to 1 (under WINDOW), gives a better representation of the data in this example. Much nicer increments! |  |
![]()
Finding Your Way Around
TABLE of CONTENTS