|
Creating a Sampling Distribution Simulation
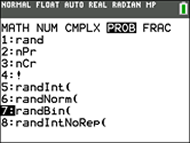
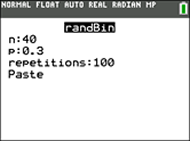
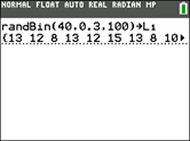
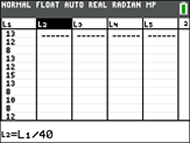
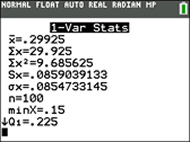
Our goal is to simulate the collection of multiple samples. For this task, we are going to use the command randBin found under MATH → PROB → #7. The parameters are For this example, the sample size is 40, the proportion is 0.3, and the number of simulation repetitions is 100. From the home screen, set randBin(40, 0.3, 100) and store the results in L1. randBin(40,0.3,100) → L1 Once L1is established, we need the proportion for each L1 sample in list L2. Type L1/40→L2 on the home screen (or from the Lists in STAT #1, move up onto L2, and type L1/40 at the bottom of the screen, hit ENTER). You now have the Sampling Distribution of the Sample Proportions in L2. Using L2 you can find the sampling mean and the sampling standard deviation for the sample proportions.
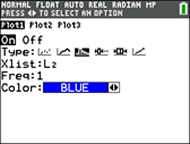
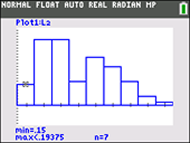
To see this Sampling Distribution from L2 as a histogram, set STAT PLOT for histogram, ZOOM #9.
|